Validation of the Precision of the Standard Photometry
The fitting results of the intrinsic colors in more than ten photometric systems as a function of (Teff, [Fe/H]) are shown in Figure 1. The fitting residuals are, respectively, 0.015-0.029, 0.010-0.016, 0.002-0.003, ~0.003, ~0.001, 0.002-0.004, and 0.005-0.006 mag for the u-, v-, g-, r-, i-, z-, and y-like bands, suggesting that the precision for individual stars is approximately 0.01–0.02 mag in the u/v-like bands and 0.001–0.005 mag in the grizy-like bands.
Figure 2 presents the magnitude offsets of standard stars in the JKC system, showing the differences between values derived from the corrected XP spectra and those from LAMSOT, as functions of G magnitude, intrinsic color (GBP − GRP), and extinction. No significant dependence on magnitude, color, or extinction is observed. Moreover, for bright sources, the scatter between the two sets of standard star magnitudes is comparable to the internal consistency of individual sources. Similar results are found across other photometric bands.
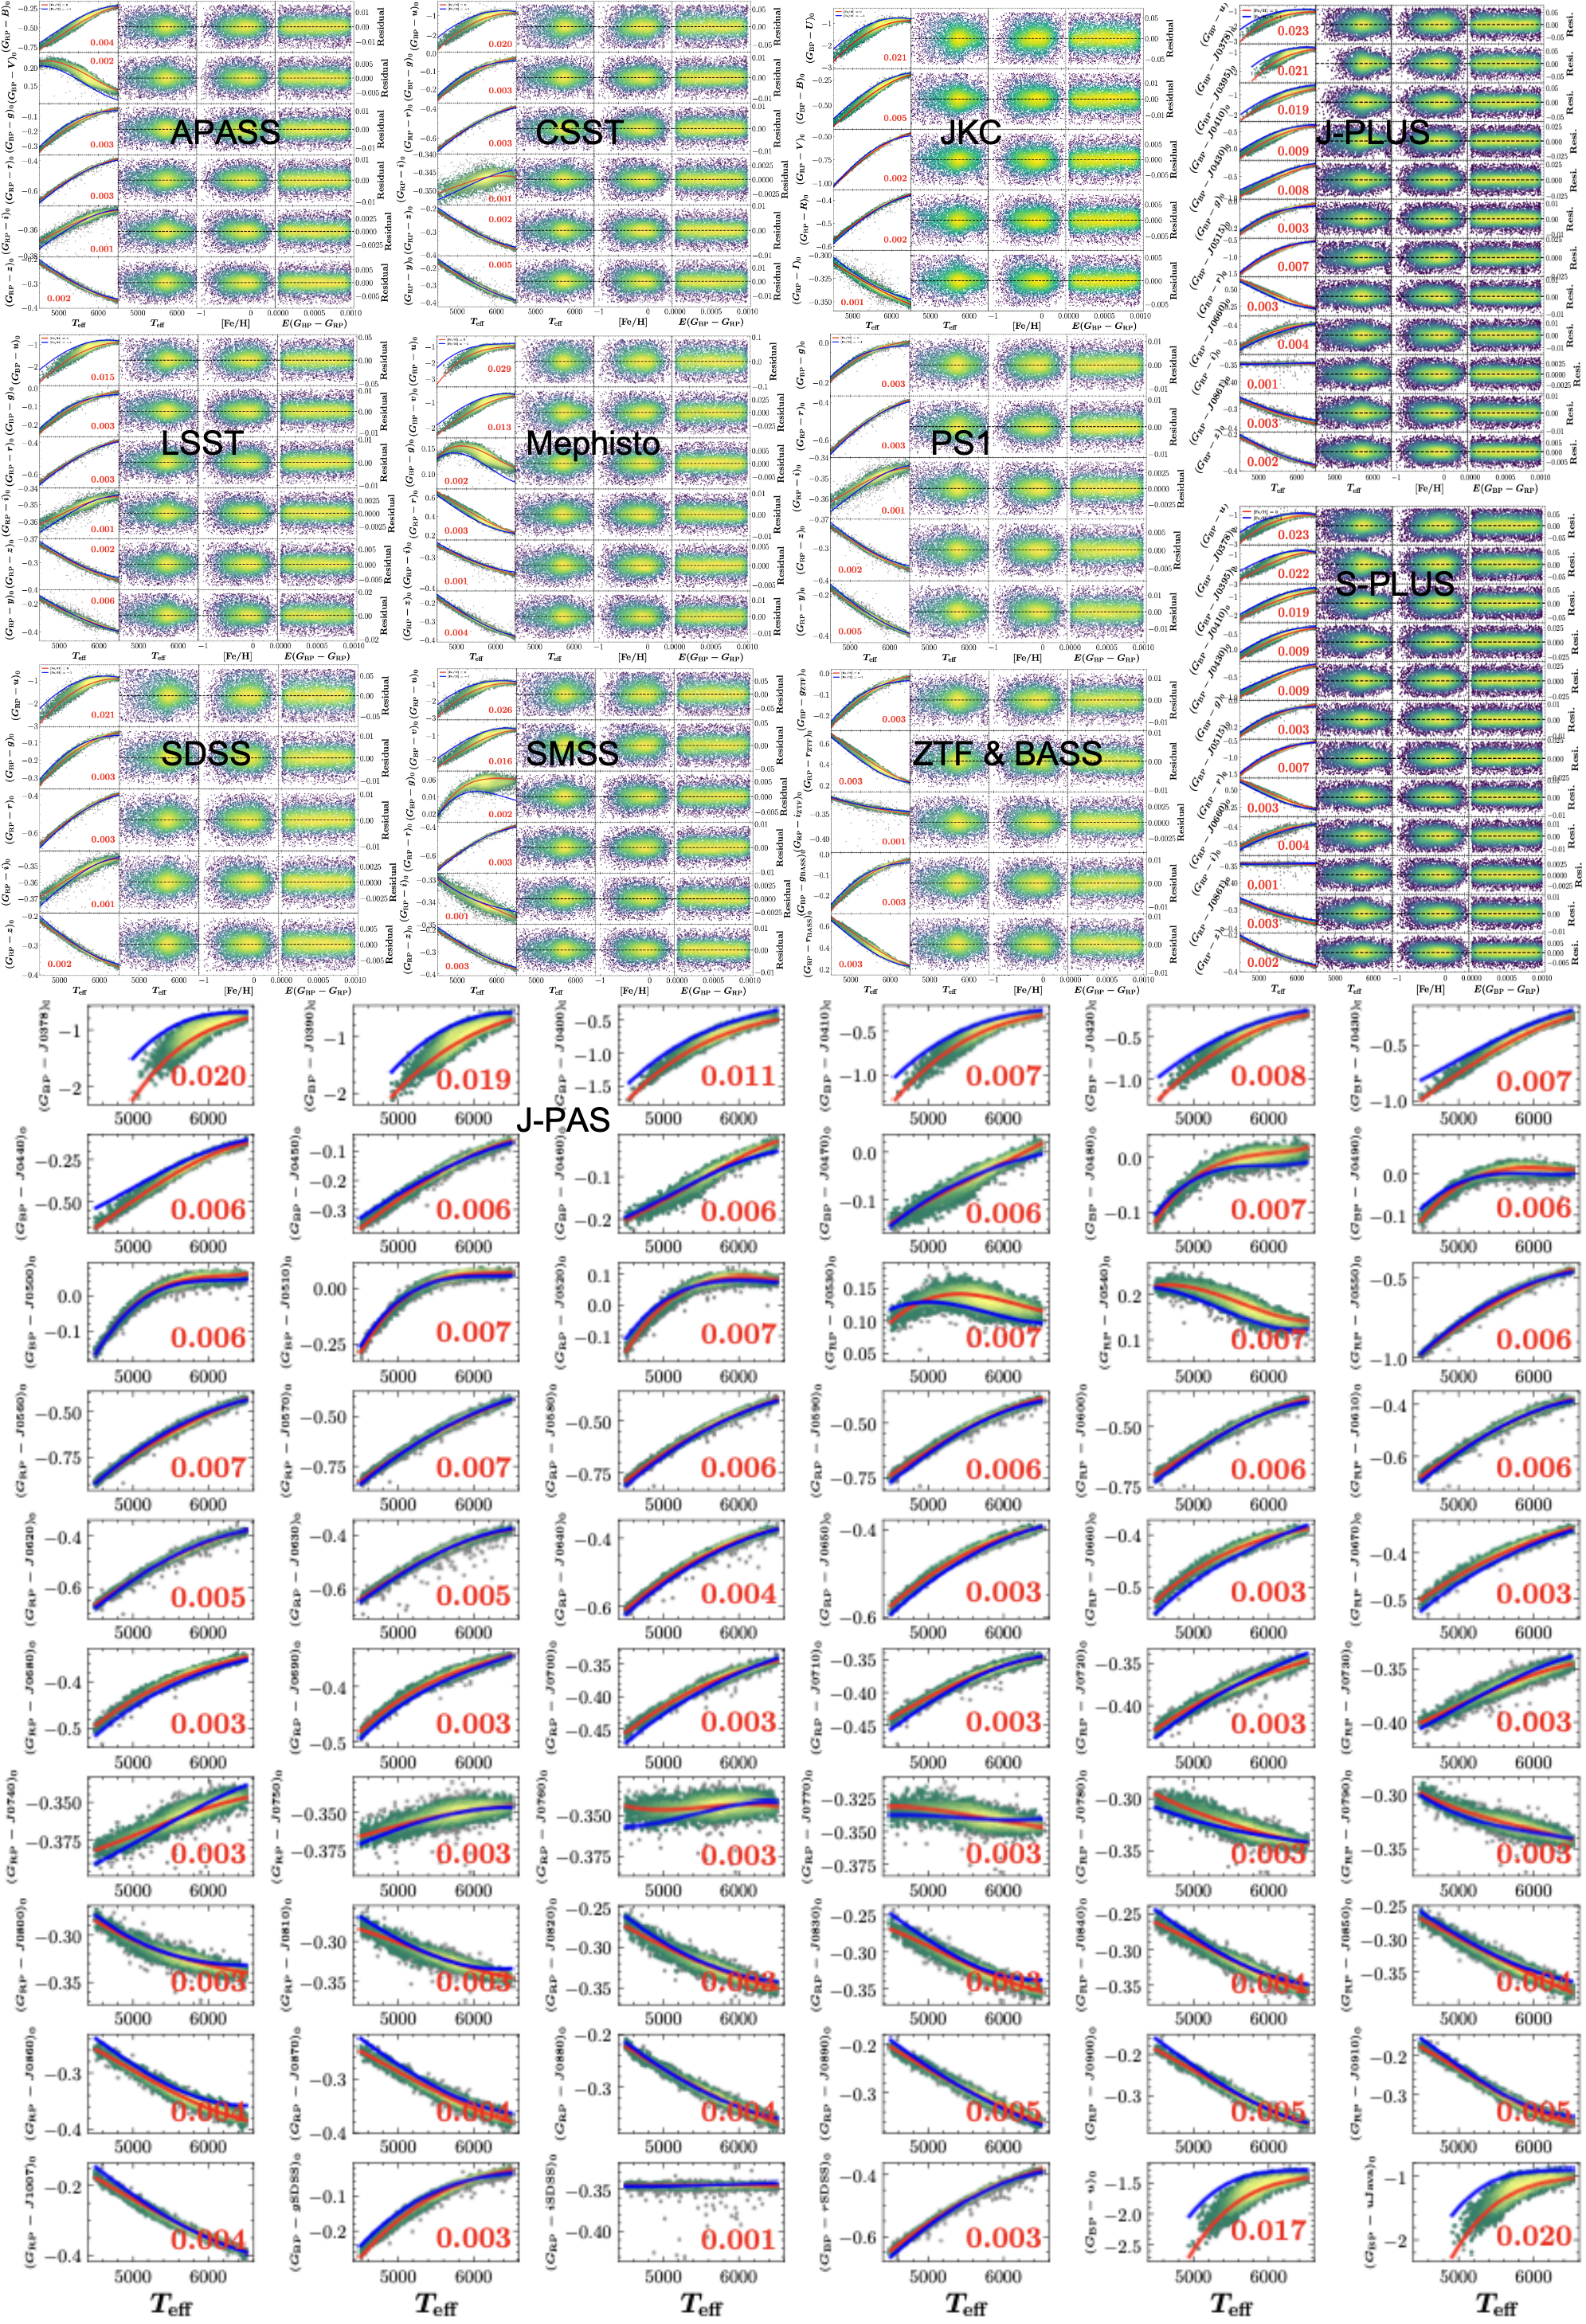

Figure 1. Two-demensional second/third-order polynomial fitting (with six/ten free parameters) of intrinsic colors as functions of Teff and [Fe/H], based on carefully selected stars from the APASS, CSST, JKC, LSST, Mephisto, PS1, SDSS, SMSS, ZTF, BASS, J-PLUS, S-PLUS, and J-PAS photometric systems. For each system (except J-PAS), the left column presents the fitting results after 3σ clipping, with outliers marked as gray plus symbols. Red and blue curves correspond to [Fe/H] = 0 and −1, respectively, and the fitting residuals are annotated in red. The second, third, and fourth columns display residuals as functions of Teff, [Fe/H], and extinction, respectively. For the J-PAS system, only the fitting result is shown to avoid visual clutter.

Figure 2. Taking the JKC system as an example, the panels show the magnitude differences of standard stars between those derived from the corrected XP spectra and from LAMSOT, plotted as functions of G magnitude (left column), color (GBP− GRP)₀ (middle column), and extinction E(GBP− GRP) (right column). From top to bottom, the rows correspond to the U, B, V, R, and I bands. Black dashed lines indicate zero-residual baselines, while red curves represent the standard deviations.